

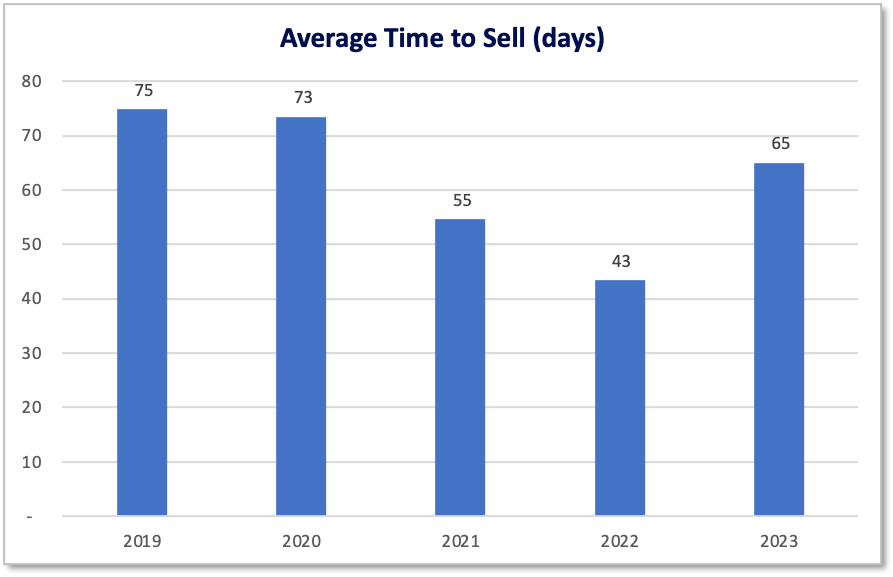
The average time to sell a property in 2023 is currently 65 days, which represents an increase of 50% year on year, according to new research from TwentyEA.
However, the 65 days it takes to sell a property today has reduced by 13% since 2019.
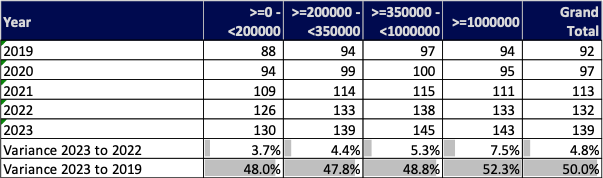
Time to exchange has increased marginally in the past year, but substantially since the pandemic. The average time to exchange a property in 2023 is currently 139 days (or 4.6 months), representing an increase on the prior year of nearly 5%.
Stuart Ducker, strategic solutions director of TwentyEA, commented: “From the data table, we can see that there is little relationship between price band and time to exchange. For example, in 2023, the time to exchange on a £1m plus property is only 10% longer than it is on a property less than £200,000.
“The average time to exchange a property by region does vary. In Scotland, the average time to exchange in 2023 was only 105 days (or just over 3 months) – this is because they have a separate legal system. Northern Ireland is at the other end of the spectrum, with 175 days or 5.8 months. Regions in England range from 124 days in Yorkshire, to 155 days in the East of England.
“There is a North South divide here with northern regions taking the least time, followed by the Midlands and the Southern regions take the longest time to exchange.”
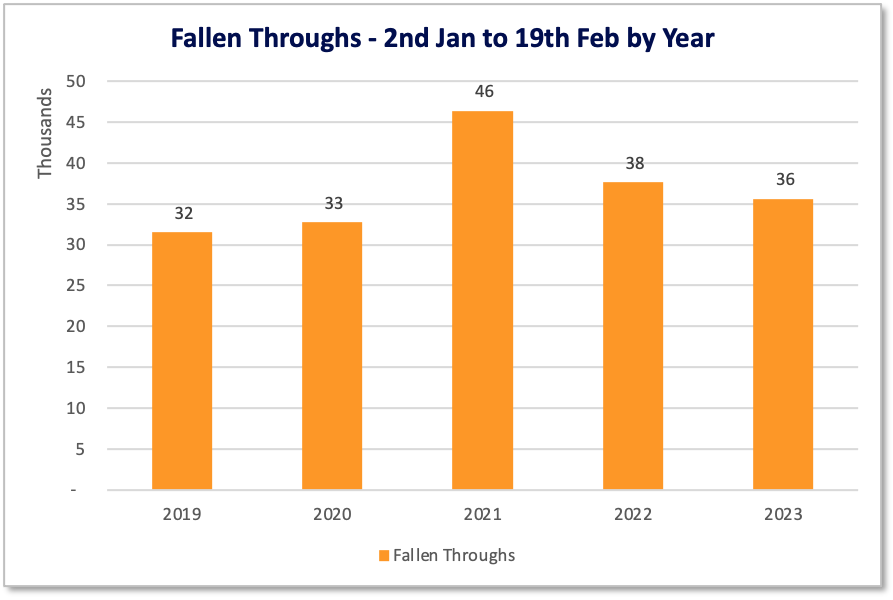
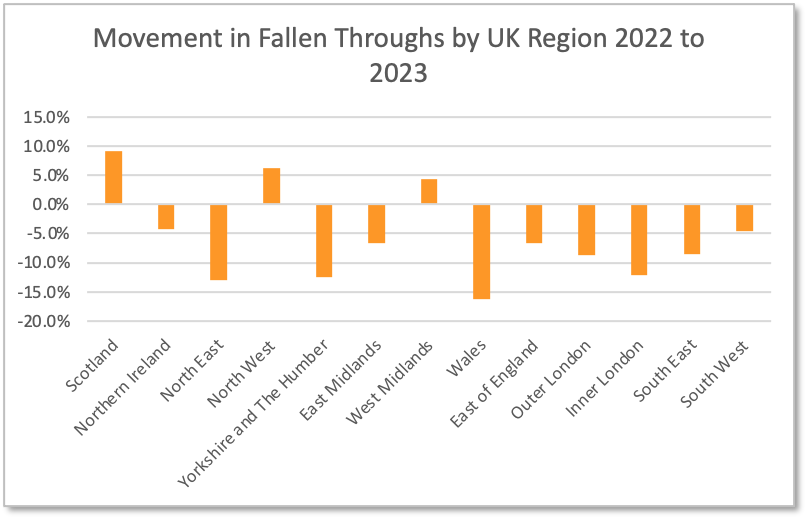
The volume of fallen throughs have reduced by over 5% in 2023 compared to the prior year. They are however still 9% higher than they were in pre-pandemic 2019.
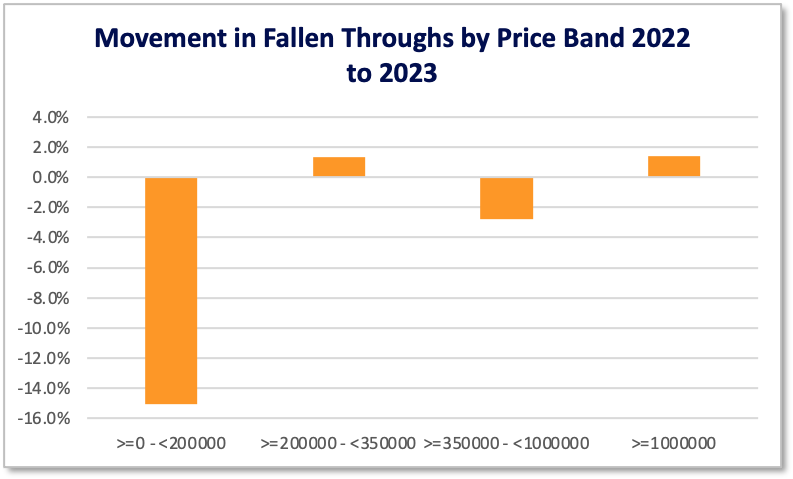
Stuart Ducker continued: “When we look at the movement in fallen through volumes in the past year by price band, we observe that the lowest priced properties (<£200k) are now significantly less likely to have a fall through than the prior year.
“On a regional level, Scotland, the North West and West Midlands have seen increases in the volume of fallen through triggers, whilst all other regions have experienced a fall in the volumes of fallen throughs. This does not really appear to be related to supply and demand.”
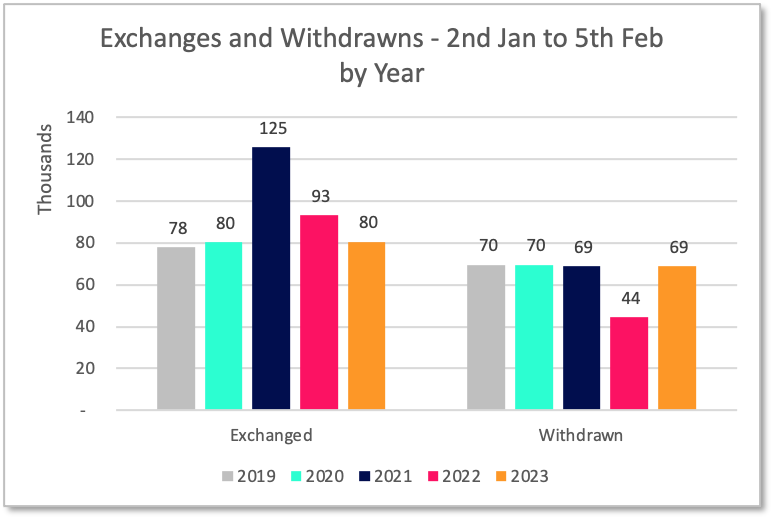
Exchanges in 2023 have fallen by 14% compared to the prior year, but the volume of exchanges is pretty similar to pre-pandemic. Volumes of withdrawns have increased by 55% in the last year and this looks like a shock until you realise that the withdrawn volumes are in fact very similar to 2019 to 2021.
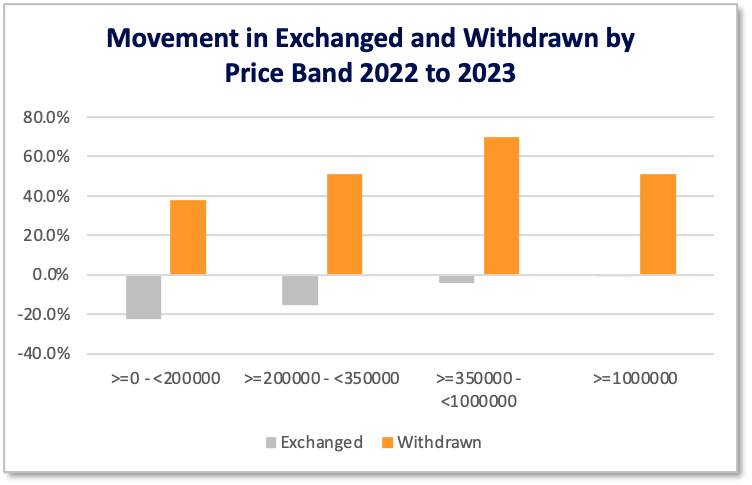
Ducker added: “The reduction in the volume of exchanges have been affected by price. In the £1m+ price bracket, we can see that the number of properties sold thus far in 2023 is about the same as 2022.
“At the opposite end of property prices, we can see that there has been a reduction in the volume of property sold of 23% in the <£200k price bracket. All price bands have seen a sharp increase in the volume of withdrawn properties compared with the prior year. This increase has been most keenly felt in the £350k-£1m price bracket.
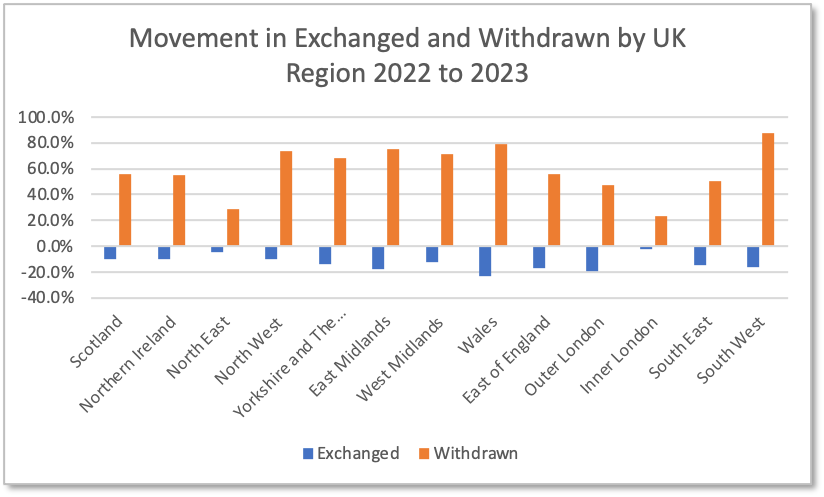
“We can see from the chart that the volume of exchanges in the last year has reduced in all regions of the UK. Inner London (at 2%) has seen the lowest reduction, with Wales seeing the highest reduction (at 24%).
“The volume of withdrawn properties has increased in every region in the last year. Once again, the smallest increase is observed in Inner London (23%). The largest increase in withdrawn properties was in the South West (at 88%).”
SOURCE: Property Industry Eye | MARCH 7, 2023 | MARC DA SILVA

 Estate Agents
Comments